Using Satellite images ( Meteosat -9 ( to calculate the Area of the dust storm that occurred on June 18, 2012 in Iraq
Azhaar K. Mishaal
Ministry of Higher Education and Scientific Researchh / Scientific Research commission Baghdad , Iraq.
E-mail : azhaar.k.mishaal@src.edu.iq
009647763648605
Abstract
Dust storms are a highly significant weather phenomenon due to their direct impact on human life in various fields. Images captured by the Meteosat-9 satellite and taken by the SIVIERI sensor were used The area covered by the storm at each stage is calculated using a digital image processing technique called unsupervised classification, specifically the ERDAS program, which utilizes satellite imagery. By analyzing satellite images and calculating the change in the area covered by the storm in each image using the ERDAS progrm , The area in the first image was (50184) km2, in the second image it was (28584) km2, in the third image it was (41328) km2, and in the fourth image it was (51192) km2. These results are consistent with the weather conditions of the areas affected by the dust storm, as the meteorological data used for the same day of the storm indicates that the wind speed was very high, which is associated with the occurrence of a storm. Thus, the areas that will be affected by the dust storm have been identified, and the degree of impact depends on the area covered by the storm and the determination of the storm’s path.
Key words :dust storm , Area, classification technology, ERDAS & Arc Map programs .
استخدام صور القمر الاصطناعي (Meteosat-9 )
لحساب مساحة العاصفة الغبارية التي حدثت في 18/6/2012 في العراق
ازهار كاظم مشعل
وزارة التعليم العالي والبحث العلمي / هيئة البحث العلمي – بغداد ، العراق
الملخص
تعتبر ظاهرة الغبار من الظواهر الجوية المهمة جدا لأنها ذات تأثير مباشر على حياة الانسان بمختلف المجالات حيث تم الاعتماد على صور القمر الاصطناعي Meteosat-9 والمأخوذة بواسطة المتحسس ( SIVIERI ) وتم حساب المساحة التي تغطيها العاصفة في كل مراحلها من خلال تطبيق احد تقنيات معالجة الصور الرقمية وهو التصنيف الغير موجه ( unsupervised Classification ) باستخدام احد البرامج التي تتعامل مع الصور الفضائية وهو برنامج ERDAS ،ومن خلال تحليل الصور الفضائية وحساب التغير في المساحة التي تغطيها العاصفة في كل صورة فضائية باستخدام برنامج ERDAS وجد ان العاصفة تتغير مساحتها حسب سرعة الانتشار للجزيئات الغبارية والتي تعتمد على المرحلة التي تمر بها العاصفة حيث كانت المساحة في الصورة الاولى هي (50184 ) كم2 وفي الصورة الثانية كانت (28584 ) كم2 اما الصورة الثالثة (41328 ) كم2 اما الصورة الرابعة كانت المساحة (51192 ) كم2 وهذه النتائج تتناسب مع الظروف الجوية للمناطق التي مرت بها العاصفة الغبارية حيث ان البيانات الانوائية التي تم الاعتماد عليها لنفس يوم العاصفة توضح ان سرعة الرياح كانت عالية جدا والتي تترافق مع حدوث عاصفة وبذلك تم تحديد المناطق التي سوف تتأثر بالعاصفة الغبارية ونسبة التأثر تعتمد على المساحة التي تغطيها العاصفة وتحديد مسار العاصفة .
الكلمات المفتاحية : العاصفة الغبارية ، مساحة ، تقنية التصنيف ، برامج ( Arc map , ERDAS ) .
1- Introduction
One of the most important phenomena that have been studied using satellite images of climate satellites is the phenomenon of dust , through time tracking of successive satellite images.
Dust storms typically occur in areas with arid climates where the average annual precipitation is less than 100 mm. [2]. Dust storms begin to form when strong, high-speed winds blow over surfaces covered with dry, loose soil that lacks vegetation. [3,4]. Most sand and dust storms (SDS) originate over loose soil or sand, and strong winds lift these particles, causing a significant decrease in visibility. Fine dust particles are suspended in the air, a process that also helps transport soil from one place to another. [5]. Many variables influence the formation and occurrence of dust storms, including soil-related factors such as soil moisture, drought duration, and desertification, as well as atmospheric variables such as rainfall, in addition to human activities. [3,6] When the wind speed is low, there will be no movement or transfer of particles, but when the wind speed reaches a critical value, a number of particles will begin to rise. [7] .
The European Meteorological Agency (EUMETSAT) operates a series of geostationary weather satellites such as Meteosat-9. These satellites orbit at the Earth’s equator and are at an altitude of 38,500 kilometers above the Earth’s surface. At this altitude, the satellite’s speed is equal to the Earth’s rotational speed. Therefore, it is called geostationary, as the satellite appears stationary above a specific point on the equator.
The satellite carries imaging devices called sensors, which use parts of the electromagnetic spectrum, including infrared and visible light, such as the SEVIRI sensor, which builds images of the Earth’s surface and atmosphere at 12 different wavelengths every 15 minutes, with a spatial resolution of 3 km [7] .
Most satellite images share a common problem: they contain geometric distortions. Geometric distortion is defined as the inaccurate positions of image elements compared to their likely positions on Earth. [8] [9] [10]
Geometrics distortion and image definition in a specific coordinate system and data [11], Geometric distortions are common in remote sensing images. Therefore, it is essential to geometrically correct the images for reliable use as a base map in a Geographic Information System (GIS), to perform accurate measurements of angles and distances from these images, or to create an accurate spatial database of various features. [12]
Unsupervised classification is the process of searching for and identifying similar natural spectral groups in multispectral images. This classification does not require prior knowledge of the image’s properties; rather, it relies solely on spectral information of the image’s various characteristics to extract features. It achieves the classification goal of identifying statistically distinct characteristics and ultimately confirms the actual attributes of each group. [13] Self-organized iterative data analysis is a self-organized iterative data analysis technique. The algorithm calculates the average value of a uniformly distributed class in the data space, then iteratively groups the remaining pixels using the minimum distance technique. In each iteration, it recalculates the average value and ranks the pixels according to the new average value. [14] Previous studies have examined the phenomenon of dust storms in Iraq using satellite imagery In 2013, researcher Hussain Zaydan Ali and others studied the dust storms phenomenon by analyzing the synoptic conditions leading to the storm and comparing them to satellite images, and concluded They are often an early warning that the depravation of environment [15] In 2018, researcher Jasim M. Rajab and others, through their study of dust storms using satellite imagery (MODIS Aqua), observed that they shed new light on the processes responsible for dust transport and emission over Iraq, which are related to northerly winds [16] In 2019, researcher Riyadh Al-Barakat and others monitored the phenomenon of satellite storms in Iraq using satellite data.NDDI computed using MODIS/Aqua surface reflectance data was applied to monitor dust storms formation and spread over Iraq and the surrounding areas. NDDI values lower than 0.05 represent clouds and water bodies, while NDDI values less than equal to 0.18 for surface features (0.05 < NDDI ≤ 0.18) and higher than 0.18 (NDDI > 0.18) for SDS and A sensitivity test was carried out to evaluate the feature-specific TB threshold values. It was found that a threshold of 310.5 K allows us to distinguish between dust storms and the ground dust and sand [17]. In 2023, researchers Ali A. Attiya and Brian G. Jones used remote sensing measurements to study dust storms over Baghdad. They employed the HYSPLIT model climate and concluded that the storms could originate from southern Turkey, eastern Syria, or northwestern Iraq [18] In 2024, researcher (Rafah Rasheed Ismail1) and others studied the temporal and spatial distribution of dust storms over Iraq, where the trail of the dust storm was determined using the HYSPLIT model, which was then compared with MODIS and Meteosat satellite images [19] In 2025, researcher Bashar M. Yahya studied the spatial distribution of dust and sand storm phenomena in Iraq using MODIS where used the Middle East Dust Index (MEDI) values derived from forty MODIS satellite data sets and climatological datasets for twelve synoptic stations. These values were used to determine the main relationships controlling dust storms in Iraq [20] A review of research on dust storm phenomena using satellite imagery revealed that most studies tracked the phenomenon through satellite images and used climate models to identify the storm’s source, but did not address the use of digital image .
- Materials and methods
2.1 The study area
The study area included the entire geographical boundaries of Iraq, which is located in the southwestern part of the Asian continent and covers an estimated area at 435,000 km2. Its geographical location includes latitude lines (29-37° North) and longitude lines (39-48° East. See Figure (1) which shows the study area, indicating the meteorological stations whose data were used, as shown on the Meteosat-9 satellite image, which was captured by the (SIVIERI) sensor with a spatial resolution of 3 km.
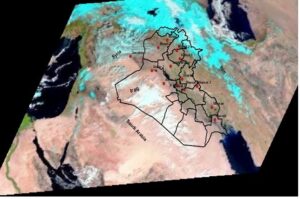
Figure 1: Area Study and Stations Selected [21]
2-2 The Data
The data used in this paper consists of two parts: the first is satellite imagery showing the dust storm that affected northern and central Iraq on June 18, 2012, captured by the Meteosat-9 satellite, based on four images taken at different times , Through which the development of the dust storm and the difference in the area it covered were monitored (see Figure 2) with a spatial accuracy of (3) km. The second part of the data consists of the meteorological data at the study stations for the same day of the storm (Table 1) [21].
 .
.
Fig ( 2 ) The images satellite for the dusty storm hours ( Meteosat -9 )
Table 1 : The Meteorological Data for the Day of dust storm ( 18 / 6 /2022 ) [22]
|
station |
Longitude | Latitude | AT Max | ATC Min | RH Max | RH Min | WSMPS Avg | WSMPS Max | WD |
|
Baghdad |
44.23 | 33.32 | 44.07 | 29.98 | 19.71 | 2.56 | 2.92 | 10.42 | 283.31 |
|
Anbar-1 |
43.03 |
33.46 |
42.3 |
26.9 | 19.6 | 3.3 | 4.7 | 13.2 | 295.9 |
|
Anbar-2 |
42 | 34.35 | 40.69 | 27.08 | 21.94 | 2.98 | 6.15 | 15.33 |
285.14 |
|
Mousl-1 |
43.33 | 36.45 | 40.96 | 25.27 | 27.25 | 5.65 | 2.88 | 11.42 |
28.72 |
|
Mousl-2 |
42.56 | 35.94 | 42.53 | 27.46 | 18.58 | 5.11 | 3.73 | 11.48 |
299.32 |
| Kirkuk-1 | 44.42 | 35.16 | 40.56 | 23.44 | 24.3 | 4.42 | 3.57 | 11.96 |
297.91 |
|
Kirkuk-2 |
44.15 | 35.73 | 42.17 | 21.42 | 25.86 | 2.81 | 7.07 | 11.43 |
151.75 |
|
Wasset-1 |
44.82 | 33.01 | 43.65 | 30.43 | 26.24 | 3.801 | 4.089 | 13.52 |
288.1 |
|
Wasset-2 |
45.91 | 33.26 | 46.57 | 28.52 | 15.42 | 0.61 | 4.93 | 13.61 |
312.24 |
|
Wasset-3 |
45.91 | 33.26 | 46.47 | 30.14 | 23.84 | 3.29 | 3.66 | 11.55 |
294.43 |
|
Salah-al dien |
43.63 | 34.65 | 40.96 | 28.69 | 15.23 | 2.27 | 5.52 | 13.3 |
294.93 |
|
Diaylaa |
44.62 | 33.75 | 42.98 | 27.53 | 24.92 | 3.55 | 2.9 | 9.45 |
262.83 |
|
Meysan |
47.19 | 31.8 | 45.86 | 29.5 | 29.75 | 4.481 | 3.652 | 12.15 |
306.2 |
| Basrah | 47.45 | 30.94 | 49.26 | 32.21 | 21.3 | 4.12 | 3.98 | 12.62 |
303.79 |
Through table (1 ) data note the weather conditions for study stations on the day of the storm occurred , where the temperature was within ( 21.4 – 49.26) which was high and relative humidity did not exceed( 29 %) As for the wind speed the range of wind speed was between ( 2.88 – 7.07 ) m/ sec were stations were recorded in ( Wasset – Salah-al dien- Anbar – Kirkuk ) highest values for the wind speed reaching ( 4.9 – 5.52 – 6.15 – 7.07 ) m/sec while the trend of wind was the north west . Figure ( 2 ) represent the satellite images that shows the form of storm within different hours is the beginning and amidst and end of the storm .
3- Results and discussion
3-1 Geometric Correction for the images
Atmospheric analysis mainly to refers the atmosphere effect along with its corresponding territory (land) features reflection (while geometric analysis).While in the correction removes effects of the atmosphere on the radiation from the territory that arrives to the camera as well as other sensor; it also converts the physical values of the image from radiance to ground reflectance. But it needs accurate observation and illumination angles for each pixel [23] [24] .
One of the most important digital image processing operations applied in this research is geometric correction, which makes satellite images identical to maps, meaning they read the true geographic coordinates. In addition, it makes it possible to perform calculations such as distance and area, etc., meaning the digital image will provide accurate readings.
The ERDAS program, a digital image processing program that deals with satellite imagery, was used to apply the satellite image Geometric correction on meteosat-9 satellite images chosen for the dusty storm study. Geometric correction is performed either using a map with known geographic coordinates or a satellite image with actual geographic coordinates and The spatial resolution of the image used for correction must be close to the resolution of the satellite image being geometrically correct.
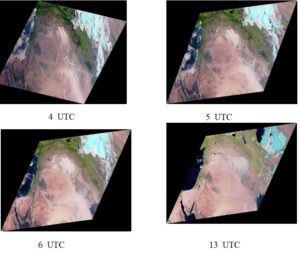
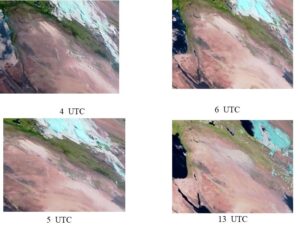
Fig ( 3 ) The images satellite after geometric correction
Figure (3) shows the satellite images after geometric correction process , resulting in images that read real coordinates and can be relied upon for various calculations. The correction process for the Meteosat-9 satellite images was based on a Terra-MODIS satellite image, which had a spatial resolution close to that of the images used in the study, with a spatial resolution of 1 km , where the error rate was a few in the correction operation as shown in table ( 2 ) .
|
Images ( UTC) |
control point Error |
| Image -1 ( 4 UTC ) |
0.0034
|
| Image -2 ( 5 UTC ) | 0.0032 |
| Image -3 ( 6 UTC ) | 0.0032 |
| Image – 4 ( 13 UTC ) | 0.0027 |
Table 2 : The Error Rate in geometric correction operation
3-2 Digital Classification
Image classification is defined as the process of categorizing all pixel in an image or raw remotely sensed satellite data to obtain a given set of labels or land cover themes [25] . General image classification procedures include: preprocessing of the image, including radiometric, atmospheric, geometric and topographic corrections image enhancement, and initial image clustering [26].
The second technique applied to the Meteosat-9 satellite images is unsupervised classification and classification was chosen because dust storms are a meteorological phenomenon, not related to soil or vegetation cover. This type of classification does not require the precision and geographical knowledge needed to select categories, as is the case with supervise classification.
The classification technique was used on satellite images to isolate the image units (pixels) representing the dust phenomenon from the rest of the image features. This was done to calculate the area according to the method used in this study, because here we are dealing with the satellite image not only in terms of visual interpretation, as we have observed in previous studies, but also as a digital image.
Since digital images have pixels that represent the spectral reflectivity values of Earth’s features, each element in the image has a number of pixels that represent it. For this reason, classification technology was used to isolate the dust storm from the rest of the image’s features.

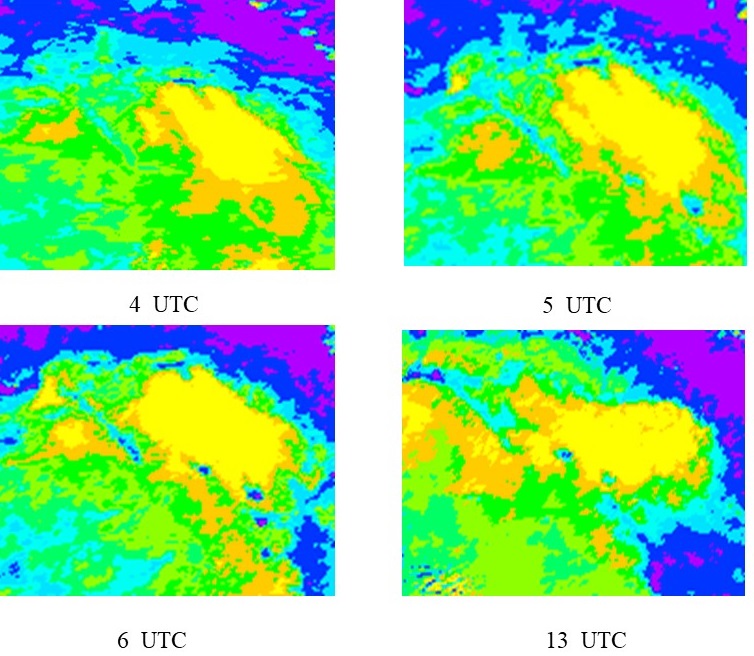
Fig ( 4 ) The images satellite after unsupervised Classification
figure ( 4) illustrate the satellite images after applying the unsupervised classification process using ERDAS program , through the interpretation of classified images where we note there are two types of dust particles concentrations ,where the dust storm phenomenon was distinguished by two colors ( yellow color represent the heavy density , brown color represent dust the light density) , where the number of pixels , Then, the total number of pixels is calculated—that is, the pixels representing the concentration of heavy dust and the pixels representing the concentration of light dust—to determine the area covered by the dust storm , This is one of the capabilities available in the EDAS program, as shown in Table 3.
Table 3: the number of pixels represents the phenomenon of dust
| Images ( UTC ) | light Dust Area
( pixel ) |
Heavy Dust Area
( pixel ) |
Total Area
dust ( pixel ) |
| Image -1( 4 UTC ) | 3214 | 2362 | 5576 |
| Image -2( 5 UTC ) | 1586 | 1590 | 3176 |
| Image -3( 6 UTC ) | 2121 | 2471 | 4592 |
| Image–4( 13 UTC) | 3139 | 2549 | 5688 |
Using one of the most important geographic information systems programs, the Arc-MAP program, the classified images were projected onto a map of Iraq showing the study stations in order to determine the path of the storm and identify the stations most affected by the dust storm see Figure (5).
In figure (5) we notice that the stations of Anbar-2 and Salah al-Din were most affected by the storm at hour ( 4 ) UTC with the least dense dust , In the second satellite image ( 5 ) UTC the stations of AL-Mousl & Salah al-Din were affected by the densest dust, but in the third image at 6 UTC in addition to the three stations ,Kirkuk station will be added and also with thick dust In the image (13) that represents the end of the storm ,it affected Anbar-2 ,Kirkuk-1, Salah al-Din and Diyala stations with thick dust , the effect of the storm on the borders of Baghdad station , Since these stations were characterized by high wind speed ( see table-1)
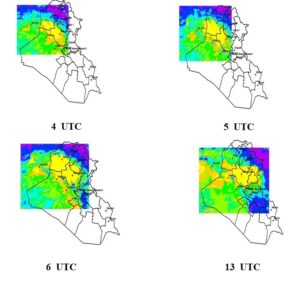
Fig ( 5 ) The satellite images classified on the map of Iraq
After applying digital image processing techniques to the satellite images selected for the study, we begin the process of calculating the area of the dust storm. This is done by knowing the number of pixels that represent the dust element in the digital image, with a high concentration of dust particles, i.e., dense dust, and a low concentration of dust particles, i.e., light dust Then we use a mathematical relationship between that the number of pixels of the element to be studied with the spatial resolution of the satellite image used Table 3 provides the total number of pixels representing the dusty storm phenomenon in each of the four satellite images studied. Given that the Metosat-9 satellite images have a spatial resolution of 3 km, the area can be calculated using the following formula :
Area Storm = Spatial Resolution ( 3 × 3 ) × Total of pixel (dust)
Table 4: the area of dust storm
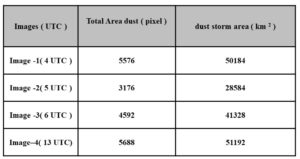
Table ( 4 ) shows the difference in the area of the dust storm during the four hours chosen for the study , that ʼs where the storm is at each image represents two types of concentration of dust ( light and heavy ) , so we notice that the storm area in the image is large because it represents the stage of rising dust particles ( light dust ) , but in the second and third images because it represents the intensity of the storm , while the fourth image increases the area of the storm because it reaches its suspended dust. Here, the research objective is achieved in two aspects: first, to calculate the area of the dust storm and its impact on the regions it passed through; And second, to deal with satellite images from the perspective that they are digital images requiring various digital processing techniques, something that was lacking in previous research that studied this phenomenon relying solely on the visual interpretation of satellite images.
4 – Conclusions
1- The importance of dust storms lies in their significant and dangerous impact on the environment and various aspects of life. Therefore, studying them through the field of remote sensing, i.e., using satellite imagery, is very important in the modern era for studying dust storms due to their frequent occurrence and their association with global climate changes, where they can be considered one of these changes.
2- Digital image processing techniques provide a good indication in the field of dealing with satellite imagery, as these techniques enable the observer to monitor elements or features in satellite images and to identify and calculate the changes that occur to them. This provides a good possibility for studying various weather phenomena.
3- The ERDAS and Arc-MAP programs are highly capable and facilitate working with satellite imagery.
4- Based on the storm that was studied, it is possible to identify the areas of eastern Syria (Deir AL-Zor) and the northwestern regions of Iraq that can be considered sources of dust storms in Iraq.
5-References
- Goudie, A.S.; Middleton, N.J. Saharan Dust Storms: Nature and Consequences. Earth Sci. Rev. 2001, 56, 179–204.
- Parolari, A.J.; Li, D.; Bou-Zeid, E.; Katul, G.G.; Assouline, S. Climate, not Conflict, Explains Extreme Middle East dust storm. Res. Lett. 2016, 11, 114013.
- Someya, Y.; Imasu, R. and Shiomi, K. Dust Aerosol Detection by the Modified CO2 Slicing Method. Sensors 2019, 19, 1615.
- Shepherd, G.; Terradellas, E.; Baklanov, A.; Kang, U.; Sprigg, W.; Nickovic, S.; Boloorani, A. D.; Al-Dousari, A.; Basart, S.; Benedetti, A., et al. Global Assessment of Sand and Dust Storms. United Nations Environment Programme (UNEP), Publication: Nairobi, Kenya, 1 September 2016; pp. 6–65.
- Qu, J.J.; Hao, X.; Kafatos, M.; Wang, L. Asian Dust Storm Monitoring Combining Terra and Aqua MODIS SRB Measurements. IEEE Geosci. Remote Sens. Lett. 2006, 3, 484–486.
- Youlin, Y.; Squires, V.; Qi, L. Global Alarm: Dust and Sandstorms from the World’s Drylands. United Nations Convention to Combat Desertification (UNCCD): Bangkok, Thailand, 2002; pp.15–25.
- Kahdom and A,Abdul Ali ; 2012 “Monitoring 3rd of March 2011 Dust Storm in Iraq Using Meteosat 9 Images “ , Iraq Journal of Science, Baghdad University, Baghdad , Iraq.
- Hosseini and J. Amini, : 2005 , “Comparison between 2-D between 2-D and 3-D transformations for geometric correction of IKONOS images,” ISPRS, Hannove. www. isprs. org/ publications/ related/ hannover05/ paper.
- Eltohamy and E. Hamza, : 2009 , “Effect of ground control points location and distribution on geometric correction accuracy of remote sensing satellite images,” in 13th International Conference on Aerospace Sciences and Aviation Technology (ASAT-13) .
- Soliman , E.H.Hamza , H E. Elhifnawy , A. F. Ragab , A. S. Elsharkawy, : 2018 “Assessment of geometric correction of remote sensing satellite images using RPC versus GCP” Engineering of Science and Military Technologies journal , Volume (2) – Issue (2) .
- K, H., Alganci and Sertel, : 2018 ,” Automated orthorectification of VHR satellite images by SIFT-based RPC refinement” . ISPRS International Journal of Geo-Information, 7(6), 229.
- Özcihan , L.D Özlü , M.I Karakap , H. Sürmeli , U. Alganci , E. Sertel ,: 2023 ,” A comprehensive analysis of different geometric correction methods for the Pleiades -1A and Spot-6 satellite images “ , International Journal of Engineering and Geosciences , 8(2), 146-153.
- Zhang , B.Du, et al ,: 2019 ,” Hyperspectral image unsuper- vised classification by robust manifold matrix factorization[J]” . Information Sciences, 2019, 485: 154-169.
- Chen , N. Luo , M. Du , : 2022 , “FINER-SCALE MONITORING AND ANALYSIS OF 2016–2021 DUST STORMS DISASTERS IN CHINA BASED ON HIMAWARI-8 SATELLITE IMAGERIES “ ,14th GeoInformation for Disaster Management (Gi4DM 2022), 1–4 November 2022, Beijing, China.
- Z,Ali , S.H.Farraj and S.A.Rashid ,:2013 ,” Analysis of Dust Storms Using Satellite Imagery and Surface Observation on Iraq “ journal of madent ALELEM college vol 5 NO 1.OF MADENT ALELEM COLLEGEMADENT ALELEM COLLEGE
- M.Rajab , I.S.Abdulfattah and H.A,Mossa ,:2018,” Monitoring Dust Storms Over Iraq Using Satellite Images acase study “, Journal of Engineering and Applied Sciences vol 13 , No 10 .
- Al barakat and V.lakshmi ,: 2019 .” Monitoring Dust Storms in Iraq Using Satellite Data “, sensors journals vol 10 .
- A.Attiya and B.G.Jones , : 2023 .” Investigation of Severe Dust Storms Over Baghdad City by Using Remote Sensing Measurements and Ground Data” , Ninth National Conference on the Environment and Natural Resources .
- R.Ismail , B.Q.Al-Aboudi and S.H.Halos ,: 2024 ,” Spatial and Temporal Analysis of Severe Dust Storm in Iraq in May 2022” , Vol 65 , No 10 .
- M.Yahya ,: 2024 ,” Spatio-Temporal Analysis of Dust/Sand Storms in Iraq Using MODIS Images” , Iraqi National Journal of Earth Science, Vol. 25, No. 2
- http://www.icare.univ-lille_fr/msg/browe/index
- Ministry of Agriculture Data ,2012” Agricultural Meteorology Project “,Unpublished data, Baghdad, Iraq
- Alonso , J. Moreno, : 2004 , ” Quasi-Automatic Geometric Correction And Related Geometric Issues in the Exploitation of CHRIS/PROBA Data “ , proc. Of the 2nd CHRIS/Proba Workshop, ESA/ESRIN, Italy.
- S. Baboo & S. Thirunavukkarasu, : 2014, ” Geometric Correction in High Resolution Satellite Imagery using Mathematical Methods : A Case Study in Kiliyar Sub Basin”, Global Journal of Computer Science and Technology: F Graphics & Vision , V 14 , No 1.0.
- M. Lillesand , R.W. Keifer , : 1994 , “Remote Sensing and Image Interpretation”
- Al-doki , S.B.Mansor and H.Z.Shafri , : 2013, ” Image Classification in Remote Sensing “, Journal of Environment and Earth Science , vol.3 , NO. 10 .